
The equity compensation percentile philosophy you choose likely matters more than your cash compensation percentile philosophy. We studied this phenomenon for one level (P3 SWEs at public companies based in the USA).
Here, let’s go a level deeper and look at this phenomenon across the P1 to P6 individual contributor (IC) SWE job ladder for all USA-based SWEs at public companies.
Senior Level Equity Compensation Distribution Benchmarks
Equity compensation benchmark distributions grow substantially wider and right-skewed at more senior levels. Looking at USA-based SWEs at public companies in Pave’s dataset illustrates this trend.
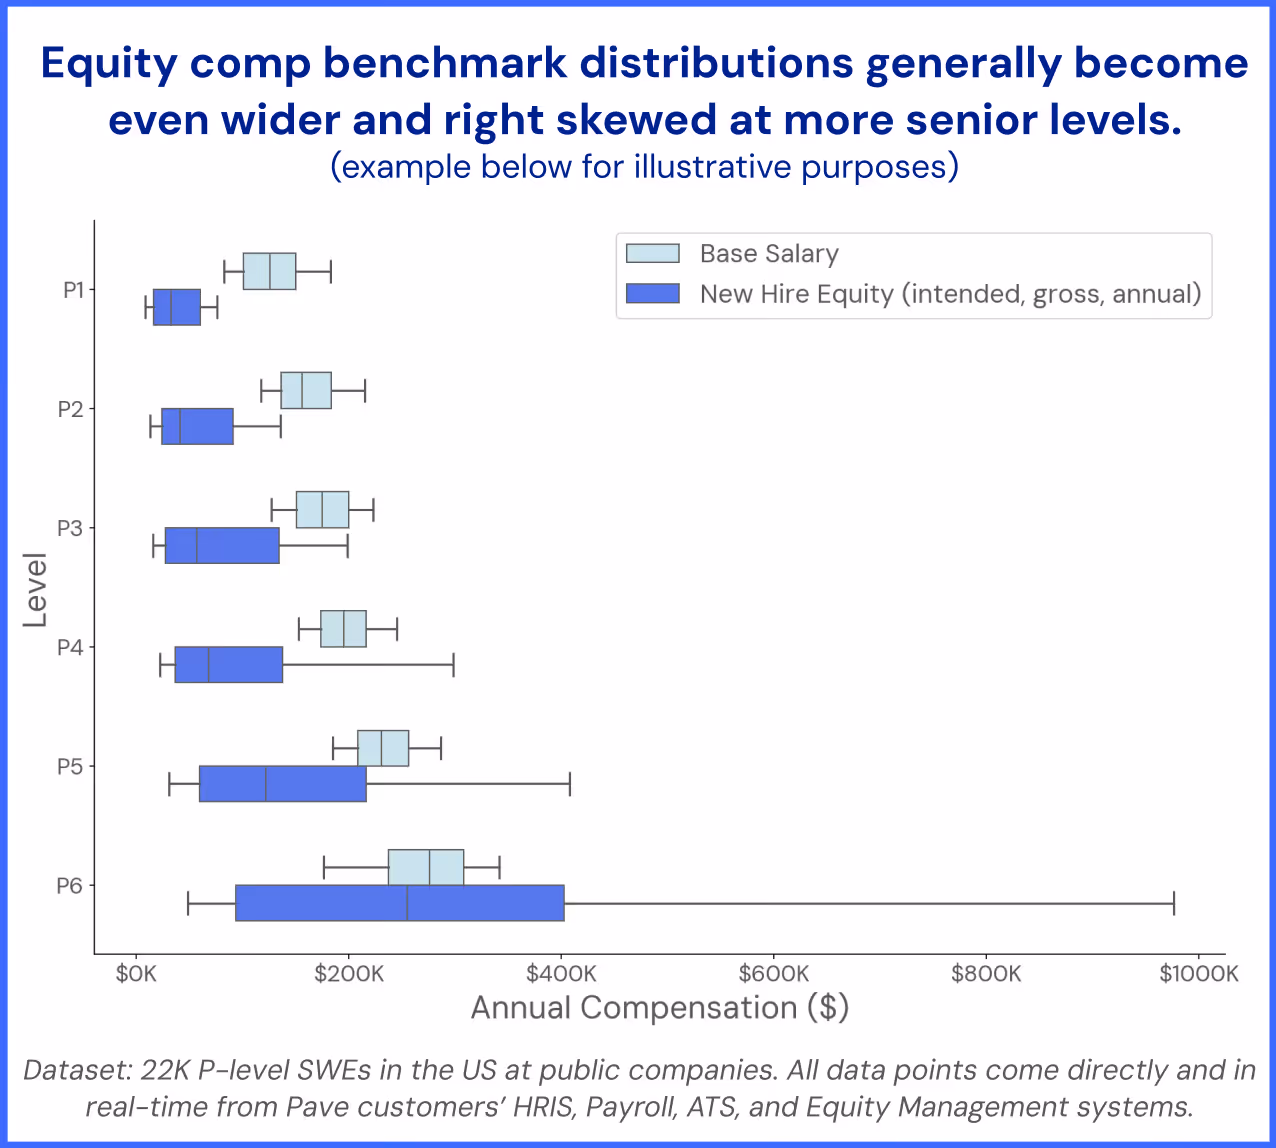
Let’s start by looking at entry-level employees, and the delta between the 50th and 90th percentile. The difference in annualized new hire equity benchmarks for P1 SWEs is ~$43k, or a ~131% premium.
Meanwhile, for base salary, the delta between the 50th and 90th percentile is ~$57k, or a ~45% premium.
Moving up the ladder to P6, the difference in annualized new hire equity benchmarks for P6 SWEs between the 50th and 90th percentile is ~$722k—that’s a ~283% premium.
The delta between the 50th and 90th percentile for base salary at the P6 level is ~$65k, or a ~24% premium.
{{mid-cta}}
Why Your Equity Compensation Percentile Philosophy Matters
In the example above, the P6 base salary premium between the 50th and 90th percentile, though larger in terms of gross dollars, is actually smaller percentage-wise (~24%) than it is for P1 (~45%). However, the new hire equity premium is substantially larger for P6 (283%) compared to P1 (~131%).
This builds on the suggestion that the equity comp percentile that you target really, really matters—moreso than your cash comp target market percentile. The stock-based expense and dilution implications of the 50th percentile vs the 75th or 90th percentiles become substantially pronounced and more important at more senior levels.
What are your company’s core values? How do they link to your compensation program? And how can you leverage long-term-incentives to support your goals while also upholding your fiscal and fiduciary responsibilities?
In short, I urge you to choose your equity comp percentile philosophy very carefully, instead of somewhat haphazardly rubber-stamping your cash compensation percentage philosophy to your equity program.
.avif)
Matt Schulman is CEO and founder of Pave, the complete platform for Total Rewards professionals. Prior to Pave, he was a software engineer at Facebook focusing on user-centric mobile experiences. A self-proclaimed "comp nerd," Matt is known for sharing data-driven thought leadership around all things compensation and personal finance.


.avif)

